Explore the Data with our Interactive Notebooks
A data notebook is a virtual interface that allows users to visualize data through guided programming. Notebooks allow users to be coproducers of their learning, to become engaged and empowered when comprehending data. You can access the data notebooks we've created under the resources tab. We also invite you to follow along with us as we visualize and interpret the data under the explore tabs, and meet the team behind this project. Navigate by using the panel located at the top of the page.
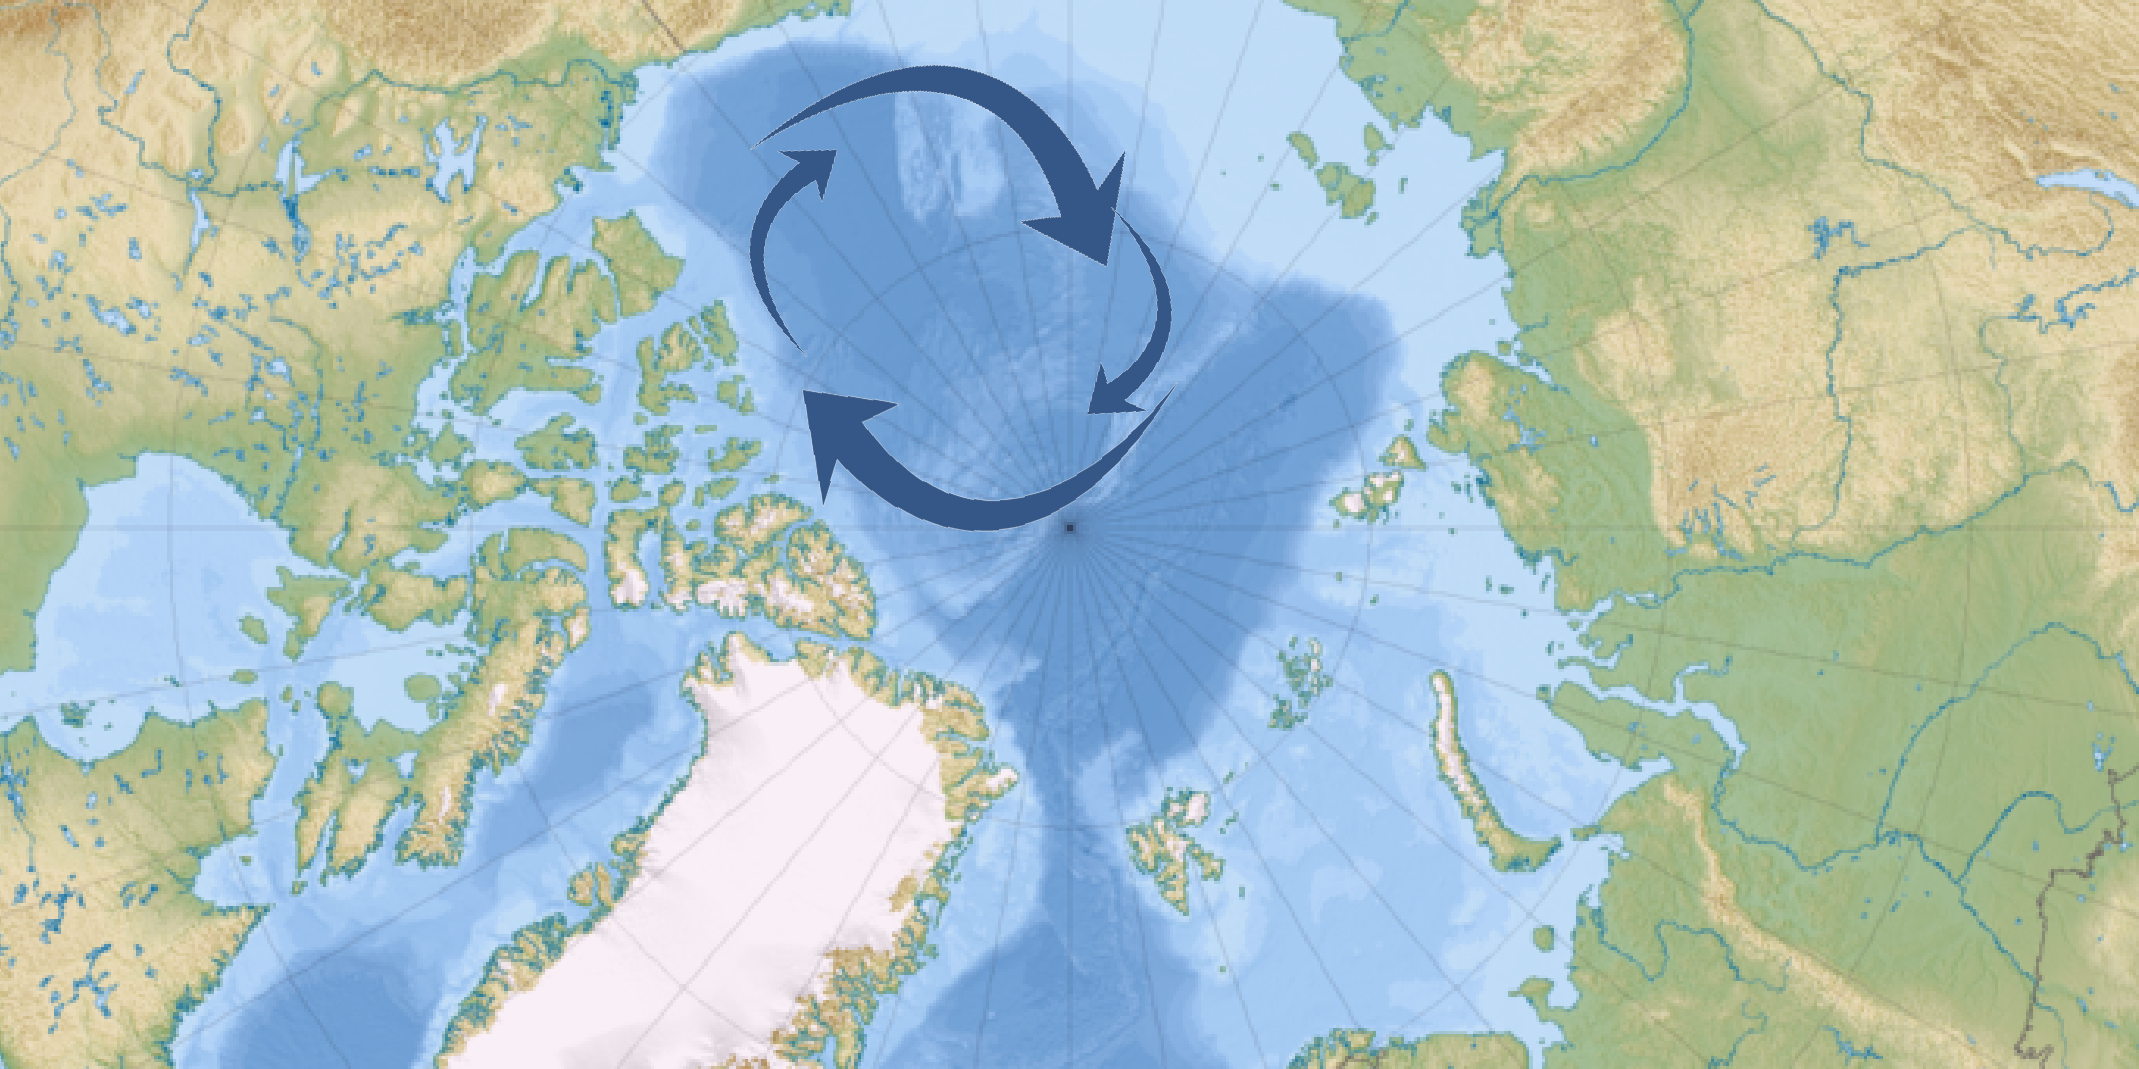
Geographic Context
The Arctic Ocean is a mystery. What we know about this elusive body of water spanning the North Pole is based on a sparse amount of knowledge due to its remoteness and hostile climate. Within the Arctic Ocean lies the Beaufort Gyre, an ice and water circulation pattern that moves in a clockwise direction. The gyre accumulates fresh water that enters the Arctic Ocean from melting sea ice and glaciers, along with river runoff from nearby land masses of North America and Asia. This naturally occuring cycle is just one part of global ocean circulation that affects the properties of our oceans.
Which ocean properties could this affect, and how?
Previous studies have shown that the air, the ice, and the oceans are interconnected. And in the age of climate change, understanding the ocean is important in developing our responses to a changing climate.
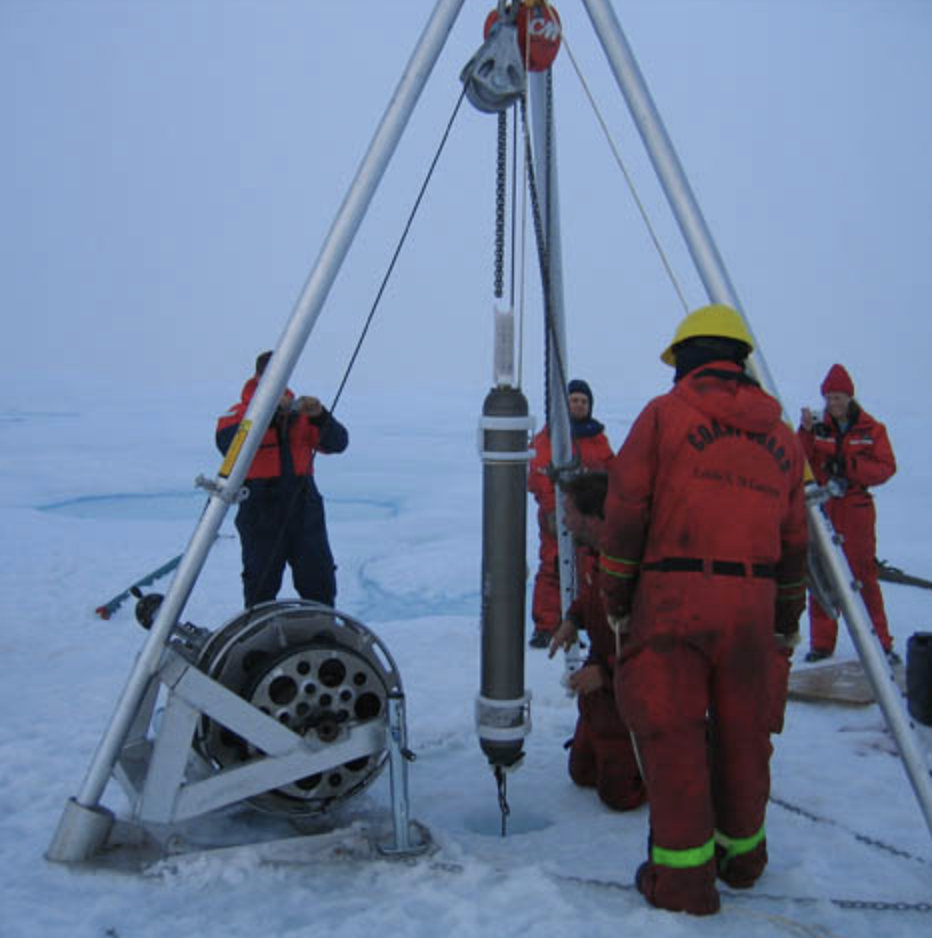
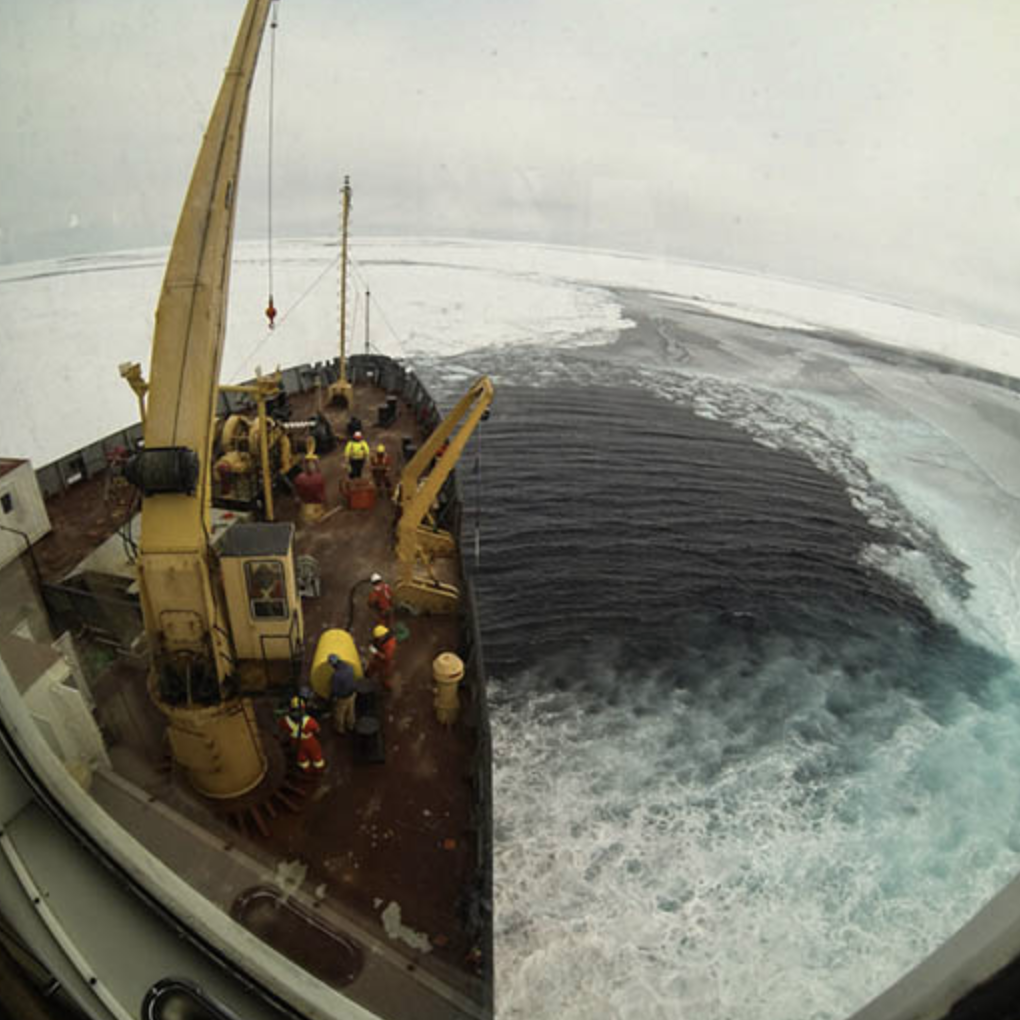
Profile Deployment
The large amount of ice covering its surface makes conventional methods of sampling the water particularly difficult. Engineers and scientists at Woods Hole Oceanographic Institution (WHOI) designed a new instrument capable of collecting Arctic Ocean data — Ice Tethered Profiler (ITP).
The profiler's top portion sits on the surface of the ice, and a long wire rope extends through the ice, down into the water, and through the water column. The component that actually conducts the sampling moves up and down along the wire, collecting measurements. This data is then sent in real-time to WHOI via a satellite link, accessible for anyone to explore and analyze.
What data could they be collecting?
Since the first deployments in the early 2000s, a large amount of data has been collected. This data spans the thousands of observations of over 100 profilers. Many are still out on the ice, actively collecting measurements on physical characteristics of the water: temperature, salinity, depth, and geographic location. This database is growing continuously, and along with it is our understanding of the Arctic Ocean.